Consumer
A consumer is a user who has read-only access to Accruent Analytics. A consumer can run reports and dashboards and save copies of reports and dashboards to the My content folder but cannot create new reports and dashboards.
Once you have logged in to Accruent Analytics, you can start working with reports and dashboards.
 Run a Report
Reports provide static snapshots of the data in your system.
To run a report:
-
In the left navigation bar, click the Team content folder.
The Team content menu opens.
-
Click into the Famis - 360Facility folder.
-
Select the Standard Reports folder.
The list of reports in this folder appears.
-
Select the report you want to run.
If the report has a prompt page, it will open, allowing you to enter your initial criteria and parameters.
-
Enter your criteria and click Finish.
The report runs and the results display.
The process described above runs a report in HTML format, but you can also run reports in other formats, including PDF, Excel, and CSV.
To designate a format in which to run a report:
-
Navigate to the report you want to run and select the More
 button.
The More menu opens.
-
Select Run as.
The Run as pane opens.
-
Select the format in which to run the report and click Run.
The report generates in the selected format.
Report Operations
Once in a HTML report, you can click on a column to perform operations on the report. For example, you can filter or sort a report by column. The available options depend on the type of column you select.
To filter a report by column:
-
Select a report column.
The column toolbar appears.
-
Click the Filter
 button.
The Filters menu appears.
-
Select Create Custom Filter…
The Filter condition dialog box opens.
-
Select values to keep or remove from the report and click OK.
The report refreshes with the custom filter applied.
To sort a report by a column:
-
Select a column and click the Sort
 button on the toolbar.
 -
Select Ascending or Descending to sort the report by the selected column.
The report refreshes with the sorting selected.
Report Views and Report Copies
A report view displays an existing standard report that has been modified to show a set of data. A report copy is a new instance of an existing standard report.
Report Views
If you want to run an existing standard report, but want to use different prompt values, schedules, output formats, or other options, you can use the report view features. Using a report view does not change the original report.
To create a report view:
-
Run a report with the prompt values or other run options you would like to use in your report view.
-
From the Save
 menu, select Save as report view.
The Save as window opens.
-
Save the report view in My content.
Your prompt values and run options are saved in the view.
If you want to edit the prompt values for the report view, open the Report View Properties pane.
You can also create a report view directly from the menu in the My content or Team content menu. To do this, open the menu next to the report name and select Create report view.
In the Properties pane for the report view, you can see a link to the source report. If the source report is moved to another location, the report view link is maintained. If the source report is deleted, the report view link breaks.
Report Copies
If you make a copy of a report, you create a unique instance of this report that is no longer associated with the original report. Using the copy feature is useful if you want to create a unique report that runs independently from the master report. Any changes made in the original report will not affect the copy. Deleting the original will not affect the copy. Users can change their copy without affecting the original.
To create a report copy:
-
Navigate to the report you want to copy and select the More
button.The More menu opens.
-
Select Copy or move.
-
Save the report copy in the desired folder.
Report Subscriptions
If you find yourself frequently running the same report you might want to subscribe to the report. Subscribing to a report runs the report at regular intervals and delivers the output to you. You can pick the subscription frequency, the desired report format, and even specify values for any report prompts. You can only create subscriptions to reports; you cannot subscribe to dashboards.
Subscribe to a report
To subscribe to a report:
-
Run the report you want to subscribe to.
-
In the top navigation bar, click the More
 button.
The More menu opens.
-
Select Subscribe.
The Subscribe dialog box opens.
This dialog box allows you to specify subscription parameters such as how often you want to receive the report, what format the report should be in, and where you want it delivered.
-
In the On day(s) pane, select the days of the week that you want to report delivered on.
-
In the Time pane, specify the time of day you want the report delivered.
If you want the report delivered more than once a day, you can create multiple subscriptions.
-
In the Format pane, click the right arrow > button to select the format(s) you want the report delivered in.
If you select several formats, multiple copies of the report will be delivered.
-
In the Delivery pane, click the right arrow > button to select the locations you want the report delivered to.
You can select any of the following options:
-
Send report by email – Select this option to have the report sent to your email account. To use this option, your 360Faciity/Famis user account must have a valid email account associated with it.
-
Print report – This feature is not currently implemented.
-
Save report – Select this option to save a copy of the report to your Accruent Analytics account. You will receive a notification containing a link to the report each time the report is generated.
-
-
In the Prompts pane, click the right arrow > button to view the prompt values that will be used when the report is run.
This value is read-only and reflects the prompts specified when you ran the report. You can create multiple subscriptions to a single report with different prompt values by re-running the report, specifying new prompt values, and creating another subscription.
If you want to create multiple subscriptions to different versions of a report, we suggest that you first run the report and select Save As to save it to your My content folder, giving it a name identifying the prompt values before creating your subscription. This way, the delivered report names will help you easily distinguish one report version from another. -
When you have finished defining the subscription parameters, click Create to create the subscription.
View a Saved Subscription Report
If you create a subscription to a report and select the Save report delivery option, you will receive a notification whenever the saved report is generated.
To view the generated report:
-
Click the Notifications
 button.
A list of your notifications appears, including any new generated reports.
-
Click the report you want to view.
A list of all the generated copies appears.
-
Click the top link to view the most recently generated copy of the report.
Manage Your Subscriptions
You can view and manage all your report subscriptions from your user account.
To manage your subscriptions:
-
In the top navigation bar, click the Personal menu
 button.
 -
Select My schedules and subscriptions.
A list of your current subscriptions opens.
-
Click the More
button to the right of the subscription you want to manage.A menu opens, allowing you to select any of the following management options:
-
Run once – Select the option to run the report once, independent of the schedule.
-
Modify this subscription – Select this option to modify subscription parameters such as when the report is run, the report format, or the report delivery options.
-
View versions – Select this option to view the versions of this subscription including information such as the run status or error message.
-
Disable/Enable this schedule – An enabled schedule shows the option to disable it and vice versa. Disabling a schedule keeps it from running without deleting it from the system. Disabled schedules can be enabled.
-
Set priority – Select this option to specify the priority from 1 to 5 for the selected report. Entries with a value of 1 are processed first and entries with a value of 5 are processed last.
-
Run a Dashboard
Dashboards are live summations of the data that are highly interactive and allow for the ability to filter and drill into the data. Dashboards exist only within the Accruent Analytics user interface – they cannot be exported or subscribed to.
To run a dashboard:
-
In the left navigation bar, click the Team content folder.
The Team content menu opens.
-
Click into the Famis - 360Facility folder.
-
Select the Standard Dashboards folder.
The list of dashboards in this folder appears.
-
Select the report you want to run.
The dashboard opens.
Dashboard Operations
This dashboard pictured above contains three tabs: Performance, Vendors, and Assets, with several widgets on each tab.
There are many ways to interact with this dashboard. You can switch tabs to view different data, you can set a global filter on the data, select a data segment to drill down into it, or use the Insights feature to view real-world ramifications of the data.
Global Filters
To set a global filter:
-
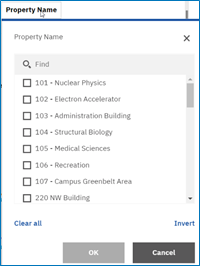
Click a filter at the top of the page.
A menu appears, allowing you to select a value to filter on.
-
Select an option (or multiple options) from the menu to filter data by and click OK.
The dashboard updates to display only those items selected from the menu.
Filter buttons
 appear on each widget on the dashboard to indicate that a global filter has been applied.
To modify or remove a filter that has been applied to a dashboard:
-
Click a Filter
button next to a widget.The currently applied filters display.
-
You can click the small X next to any filter to remove it.
-
Depending on the widget, you can also click the Edit filter
 button to edit the filter.
You can also set a global filter by selecting data segments within a widget. For example, clicking a bar in bar chart filters each widget by the data represented in that segment.
Insights
The Insights button on the upper right of a widget enables you to view an average of the data given, any meaningful differences in the data, and predictive strength if there is enough data to do the calculation.